20. scikit-image HOG
scikit-image HOG
Now that we've got a dataset let's extract some HOG features!
The scikit-image package has a built in function to extract Histogram of Oriented Gradient features. The documentation for this function can be found here and a brief explanation of the algorithm and tutorial can be found here .
The scikit-image
hog()
function takes in a single color channel or grayscaled image as input, as well as various parameters. These parameters include
orientations
,
pixels_per_cell
and
cells_per_block
.
The number of
orientations
is specified as an integer, and represents the number of orientation bins that the gradient information will be split up into in the histogram. Typical values are between 6 and 12 bins.
The
pixels_per_cell
parameter specifies the cell size over which each gradient histogram is computed. This paramater is passed as a 2-tuple so you could have different cell sizes in x and y, but cells are commonly chosen to be square.
The
cells_per_block
parameter is also passed as a 2-tuple, and specifies the local area over which the histogram counts in a given cell will be normalized. Block normalization is not necessarily required, but generally leads to a more robust feature set.
There is another optional power law or "gamma" normalization scheme set by the flag
transform_sqrt
. This type of normalization may help reduce the effects of shadows or other illumination variation, but will cause an error if your image contains negative values (because it's taking the square root of image values).
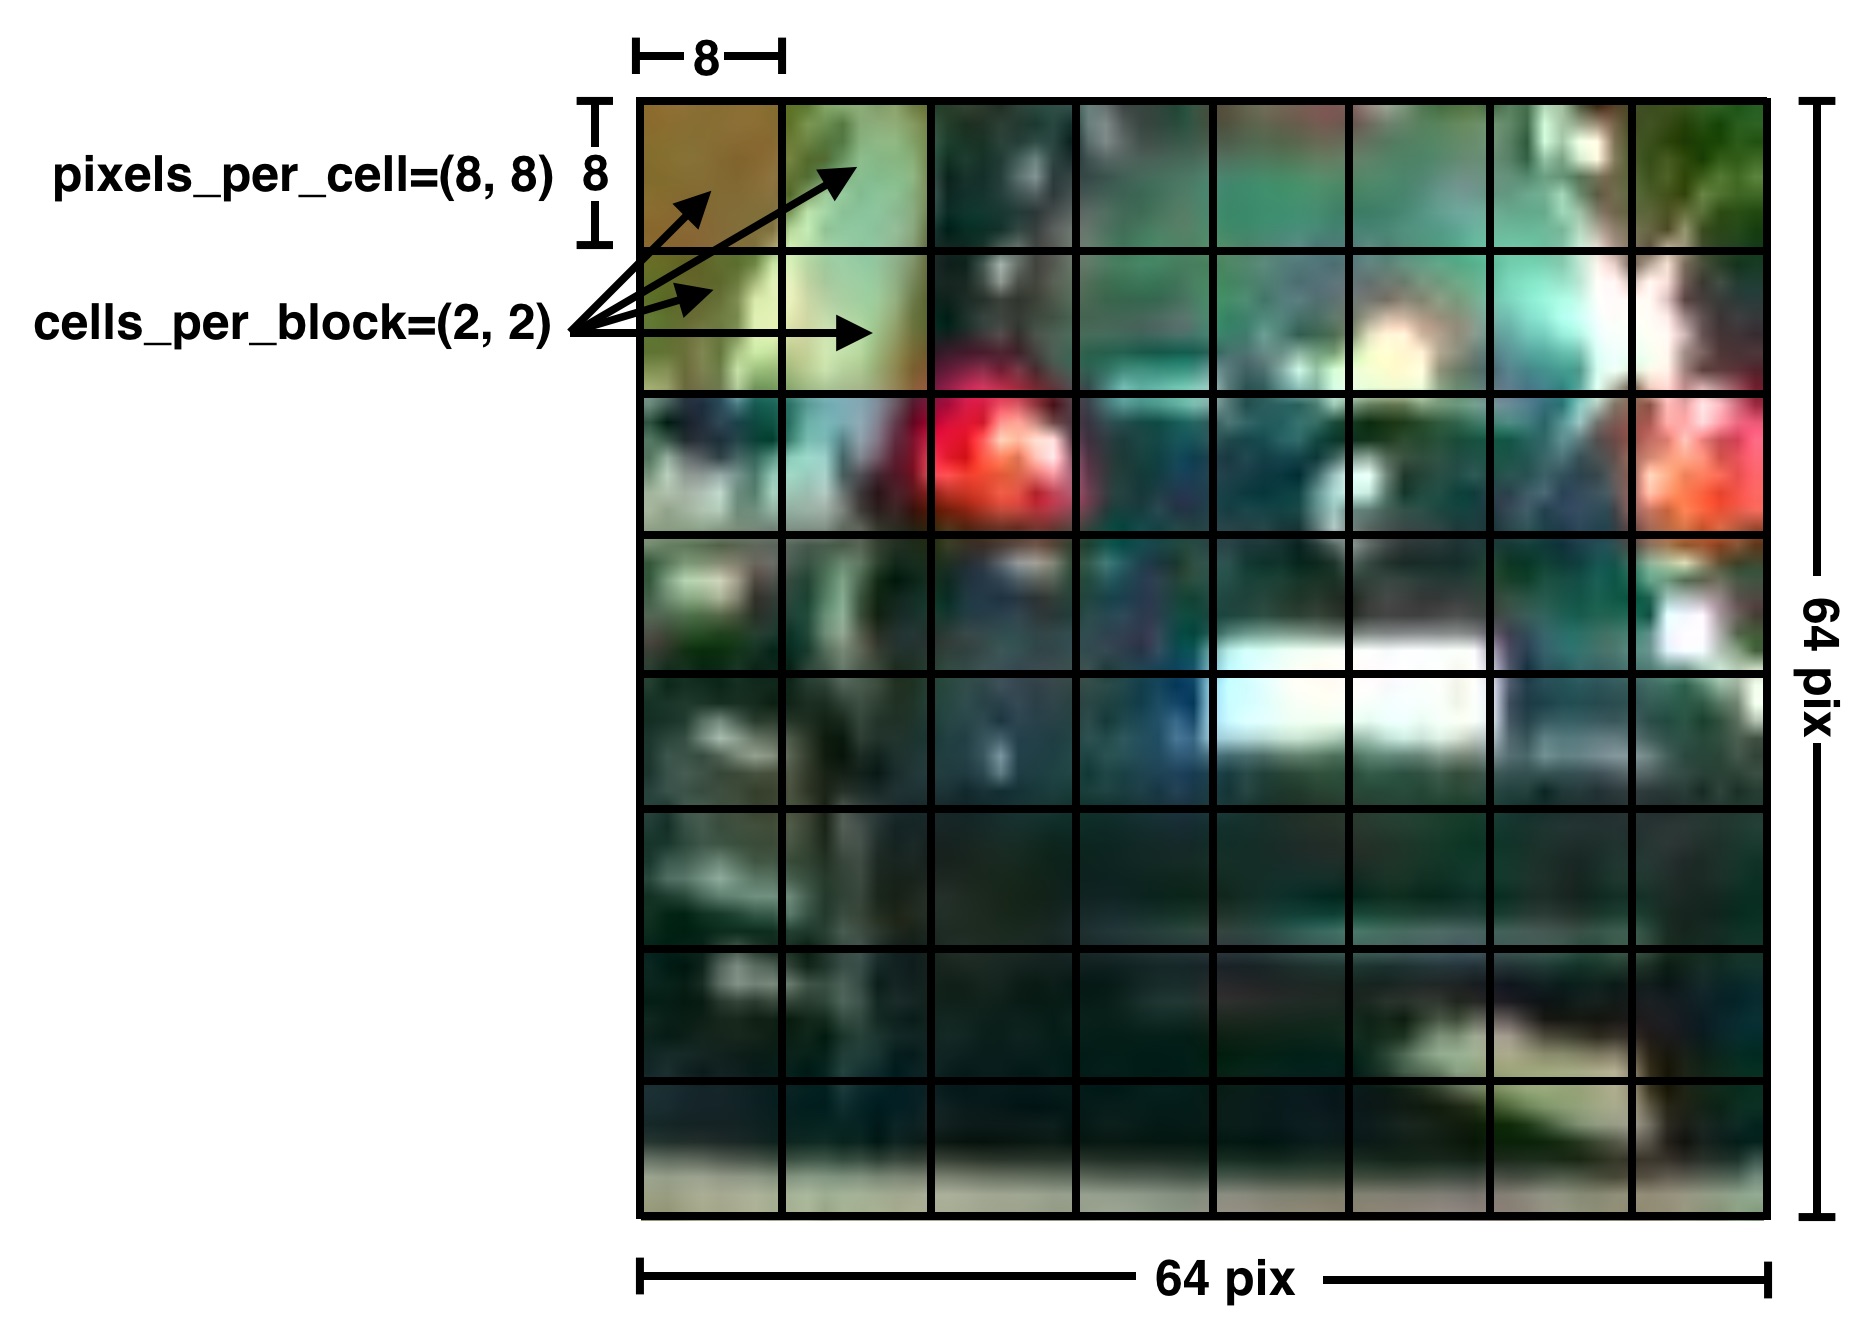
This is where things get a little confusing though. Let's say you are computing HOG features for an image like the one shown above that is
64\times64
pixels. If you set
pixels_per_cell=(8, 8)
and
cells_per_block=(2, 2)
and
orientations=9
. How many elements will you have in your HOG feature vector for the entire image?
You might guess the number of orientations times the number of cells, or 9\times8\times8 = 576 , but that's not the case if you're using block normalization! In fact, the HOG features for all cells in each block are computed at each block position and the block steps across and down through the image cell by cell.
So, the actual number of features in your final feature vector will be the total number of block positions multiplied by the number of cells per block, times the number of orientations, or in the case shown above: 7\times7\times2\times2\times9 = 1764 .
For the example above, you would call the
hog()
function on a single color channel
img
like this:
from skimage.feature import hog
pix_per_cell = 8
cell_per_block = 2
orient = 9

hog_features, hog_image = hog(img, orientations=orient,
                          pixels_per_cell=(pix_per_cell, pix_per_cell),
                          cells_per_block=(cell_per_block, cell_per_block),
                          visualise=True, feature_vector=False,
                          block_norm="L2-Hys")
The
visualise=True
flag tells the function to output a visualization of the HOG feature computation as well, which we're calling
hog_image
in this case. If we take a look at a single color channel for a random car image, and its corresponding HOG visulization, they look like this:
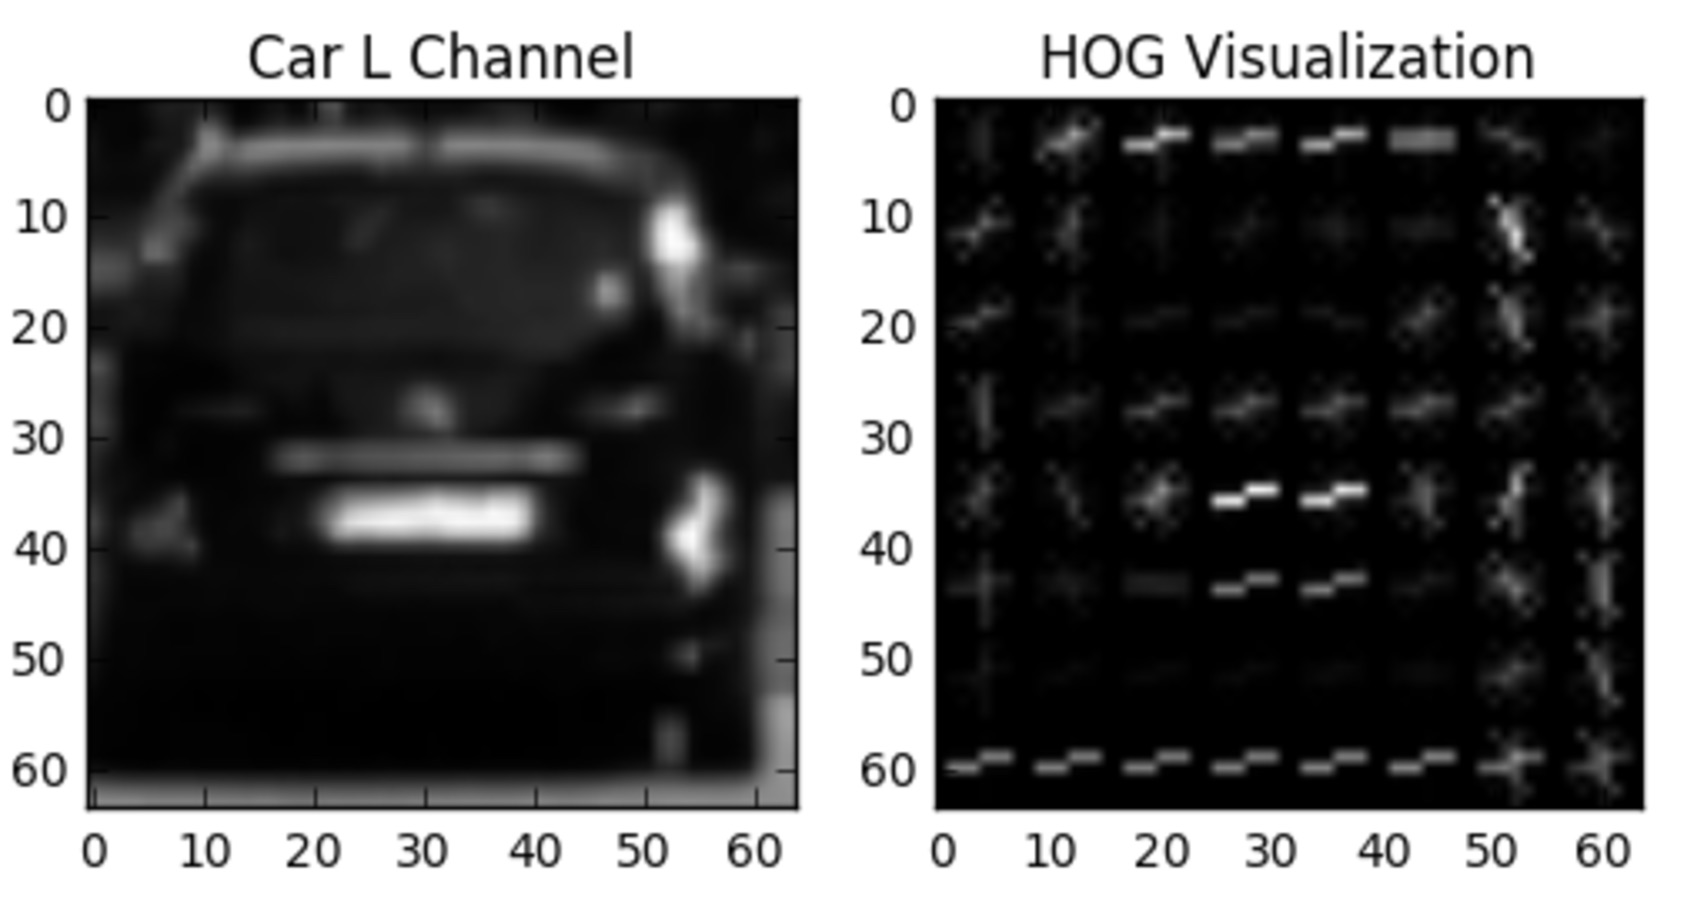
The HOG visualization is not actually the feature vector, but rather, a representation that shows the dominant gradient direction within each cell with brightness corresponding to the strength of gradients in that cell, much like the "star" representation in the last video.
If you look at the
hog_features
output, you'll find it's an array of shape
7\times7\times2\times2\times9
. This corresponds to the fact that a grid of
7\times7
blocks were sampled, with
2\times2
cells in each block and
9
orientations per cell. You can unroll this array into a feature vector using
features.ravel()
, which yields, in this case, a one dimensional array of length
1764
.
Alternatively, you can set the
feature_vector=True
flag when calling the
hog()
function to automatically unroll the features. In the project, it could be useful to have a function defined that you could pass an image to with specifications for
orientations
,
pixels_per_cell
, and
cells_per_block
, as well as flags set for whether or not you want the feature vector unrolled and/or a visualization image, so let's write it!
# Define a function to return HOG features and visualization
# Features will always be the first element of the return
# Image data will be returned as the second element if visualize= True
# Otherwise there is no second return element

def get_hog_features(img, orient, pix_per_cell, cell_per_block, vis=True, feature_vec=True):

    # TODO: Complete the function body and returns
    pass
Note:
you could also include a keyword to set the
tranform_sqrt
flag but for this exercise you can just leave this at the default value of
transform_sqrt=False
.
Start Quiz: